When you are using the HubSpot+WhatsApp integration to connect with your contacts, one of the most important things to focus on is - WhatsApp web business reporting. And this feature is now live, and accessible to only the Professional Plan users of our WhatsApp HubSpot integration.
Now before we proceed further, I have 3 questions for you.
- Do you think reporting is important for your business?
- Do you often utilize data to drive your business decisions?
- Would you like some quick insights on how your team can make WhatsApp communication more effective?
If you answered Yes to all the above questions, this blog is for you.
If not, I’d suggest you start with this article on why it’s time for your company to become data-driven!
Why do you need Reporting in WhatsApp Web Business?
Reporting in any aspect of your business is important to keep track of your data, measure your performance, and analyze what can be improved.
As a user of our HubSpot+WhatsApp solution, you can do the same by utilizing the WhatsApp reporting dashboard. It displays important data points from your WhatsApp conversations which can give you a fair sense of your communication effectiveness, detect early issues of inefficiency, and analyze what can be done to avoid them.
In a nutshell, it enables you to make data-driven decisions that improve your sales or customer support efficiency. And thus drives your business towards success.
Here’s a short demo.
That pretty much sums up the basics of the reporting dashboard. But in the subsequent paragraphs, we would be delving deeper into each of these features, and how to utilize them better. We would also be sharing tips and use case videos to avoid the errors you spot in your WhatsApp communication. So read along!
How to Get Started with Reports?
- You can access it from the CRM Extension on the right panel of your HubSpot contact timeline.
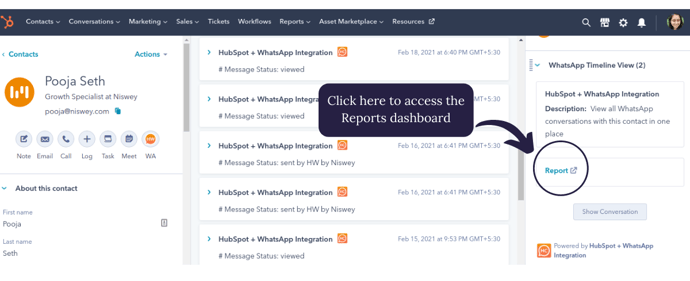
- It showcases the data for the number from which you are logged in to the HubSpot+WhatsApp integration.
- You can use it to view the data for any time period since you started using the HubSpot integration with WhatsApp web business solution even though the Reporting feature wasn't available then.
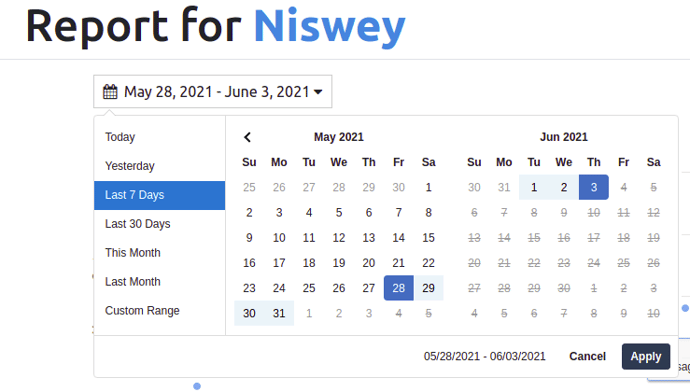
- You get to look at data points like the most popular response time of your contacts, the total number of messages received, sent, or viewed. You can also compare this data with previous periods, and across days to observe any patterns.
Here’s how.
Features of the WhatsApp Reporting Dashboard
1. Average Message Sent hour per day
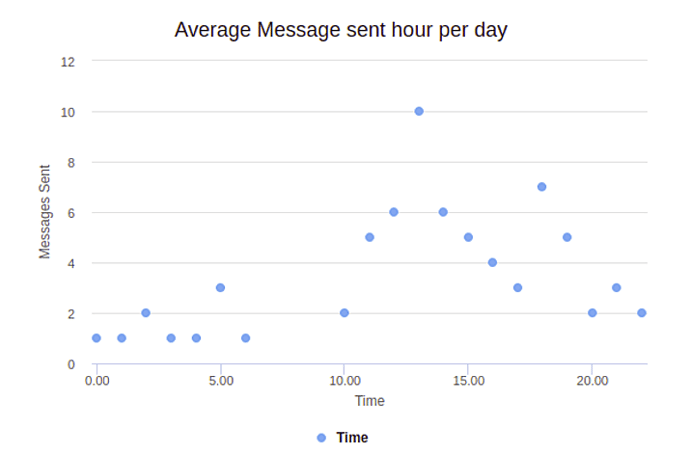
This is a report of the average number of messages sent at different hours of the day, for a specified period of time. By looking at this, you can get an insight into when your sales reps are the most active on WhatsApp.
According to the above graph, the most active time is 1 PM.
(Please note that currently all time on the dashboard is reported in UTC +5:30. But our team is working on making this possible to view in your local time zones.)
2. Average Message Received hour per day
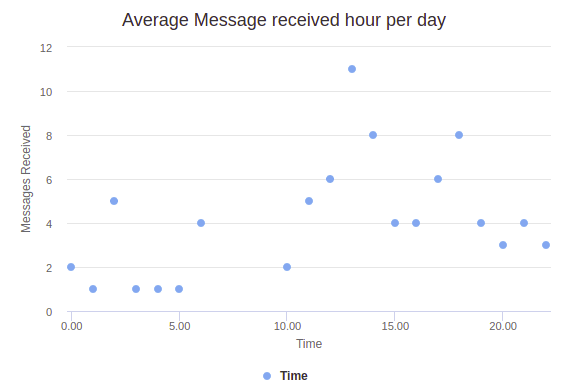
This is a report of the average number of messages received at different hours of the day, for a specified period of time. By looking at this, you can get an insight into when are your sales reps getting the most number of inquiries on WhatsApp.
According to the above graph, the most active time is 12 PM.
So while most of your prospects are reaching out to you at 12 PM, your reps are responding to most of them at 1 PM. This leaves a 1-hour gap in your response time. In some cases, it could be even higher.
In a world where after just five minutes, the odds of qualifying a new lead decreases by 10x, responding after an hour can highly reduce your chances of conversion. And if you are looking to shorten your sales cycles as the Anahuac Mayab University did, we suggest it's time for a change!
So here’s what you can do to ensure faster response times on WhatsApp using HubSpot:
- Use our WhatsApp web business Reporting to give you an insight into the response time difference.
- Make your sales reps aware of this time difference, and the most frequent time of receiving messages from your prospects. You can also take steps like having a dedicated rep for that hour of the day to handle the heavy influx of queries.
- Ensure your sales rep has their HubSpot+WhatsApp extension desktop notifications on to receive alerts for any new messages.
- Set up automated reminders for your team for leads with high buying intent.
Here’s our video tutorial on how to get notified if a new lead with high buying intent has reached out.
3. Message Actions
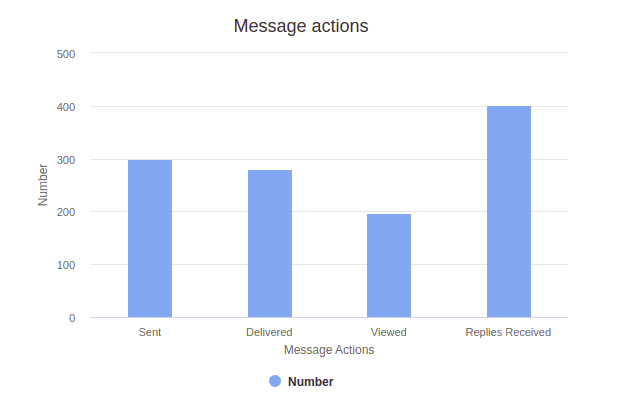
This graph depicts the number of messages sent, delivered, viewed, and replies received for any specific time period. Here are some insights you can draw from it.
- The difference between the no. of messages sent Vs delivered suggests that X number of messages are not being delivered on WhatsApp. This could be because of incorrect phone numbers of your database, so time for some database cleaning!
Here’s a video tutorial on how to optimize your WhatsApp message delivery by cleaning your database. - The number of messages viewed gives you an idea of the open rates of your delivered messages on WhatsApp.
- The number of replies received on WhatsApp is in proportion to the number of messages sent. So while a higher number of replies denote that your contacts are engaged, it could also mean that your reps are not promptly replying to the messages received. You can further verify this difference with the data on avg messages sent vs received per hour per day.
In case your replies received are lower in comparison to the messages sent, you may want to push for your sales teams to follow up. Here’s how to set automated reminders to follow-up on prospects before the leads turn cold.
4. Timeline Comparison of Message Actions
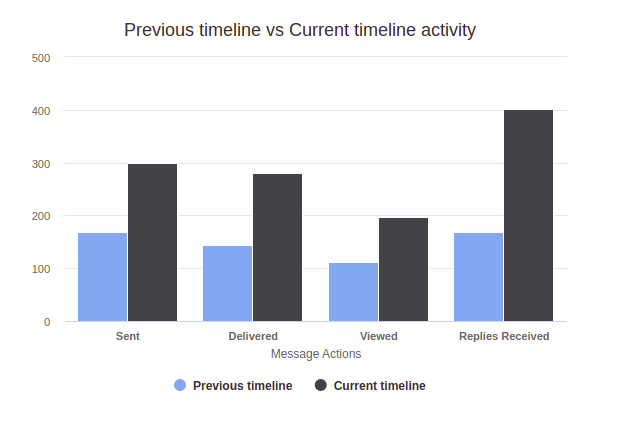
This graph shows the comparative data of the currently selected period Vs the previous period. For example, if you are viewing data of the current month, the 'previous timeline' showcases the data of the last month.
By looking at this, you can gain an idea of any lags such as decreasing sent rate or response rate. You can also look at the sent vs replied ratio of the current and previous timeline, and analyze if the ratio has increased. This would then denote an increasing number of sales opportunities on WhatsApp.
5. Day-wise Comparison of Message Sent Vs Received
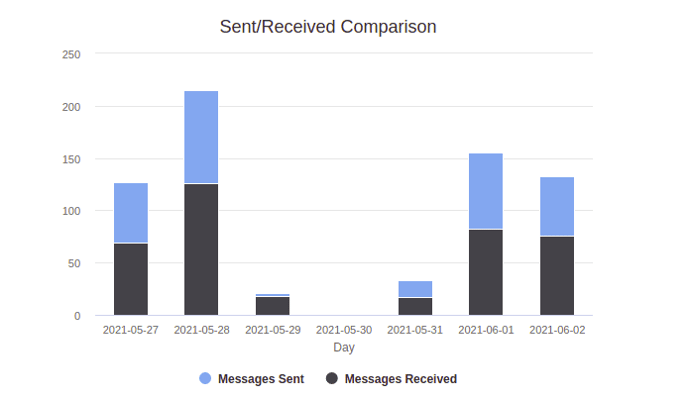
This report shows the message sent vs received comparison per day basis, thus giving an insight into which are the most engaging days for WhatsApp conversations.
So those were the features or data points from the WhatsApp reporting dashboard. I hope that gives you an insight into how to utilize this data to grow your business, as well as minimize any errors in your WhatsApp conversations!
If you are a new visitor or user of HubSpot WhatsApp integration, you may also want to check out our blog on the HubSpot+WhatsApp features. Or book a demo with us to learn more about the HubSpot+WhatsApp integration.


